> For the complete documentation index, see [llms.txt](https://docs.akto.io/llms.txt). Markdown versions of documentation pages are available by appending `.md` to page URLs; this page is available as [Markdown](https://docs.akto.io/integrations/opentelemetry.md).
# OpenTelemetry
Send metrics and heartbeat events from Akto's hybrid modules to an OpenTelemetry endpoint.
{% hint style="info" %}
#### Prerequisites
Before setting up the OpenTelemetry Integration, ensure you have the HTTP header name and value (API key) for authentication with the OpenTelemetry endpoint.
{% endhint %}
## Quick Setup Steps
{% stepper %}
{% step %}
**Access Integrations**
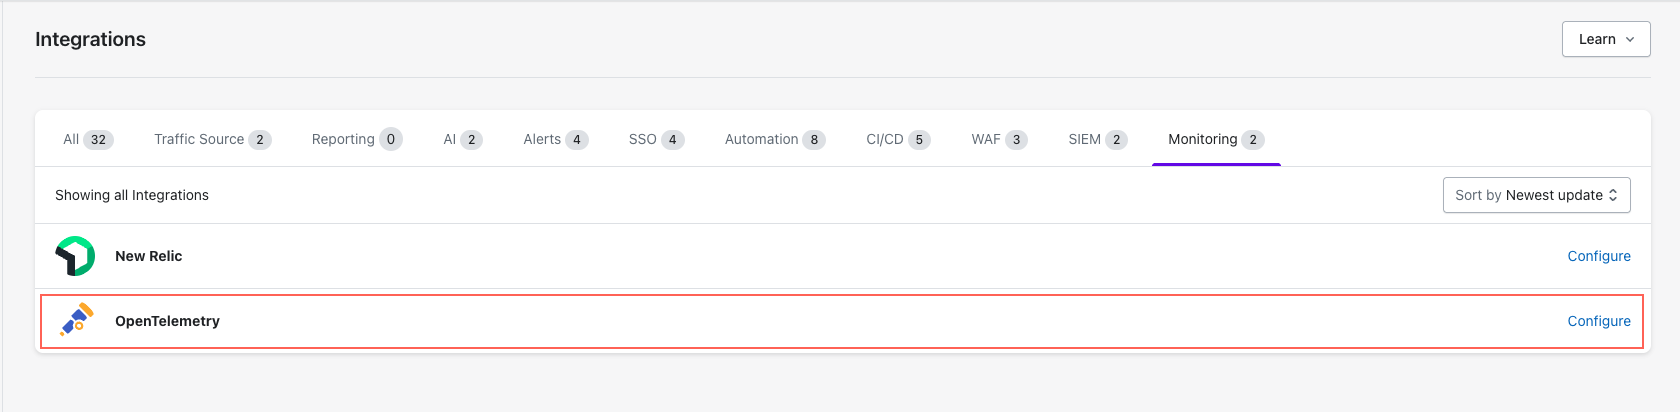
* Go to **Settings > Integrations**.
* Find and click **"Configure"** next to OpenTelemetry.
{% endstep %}
{% step %}
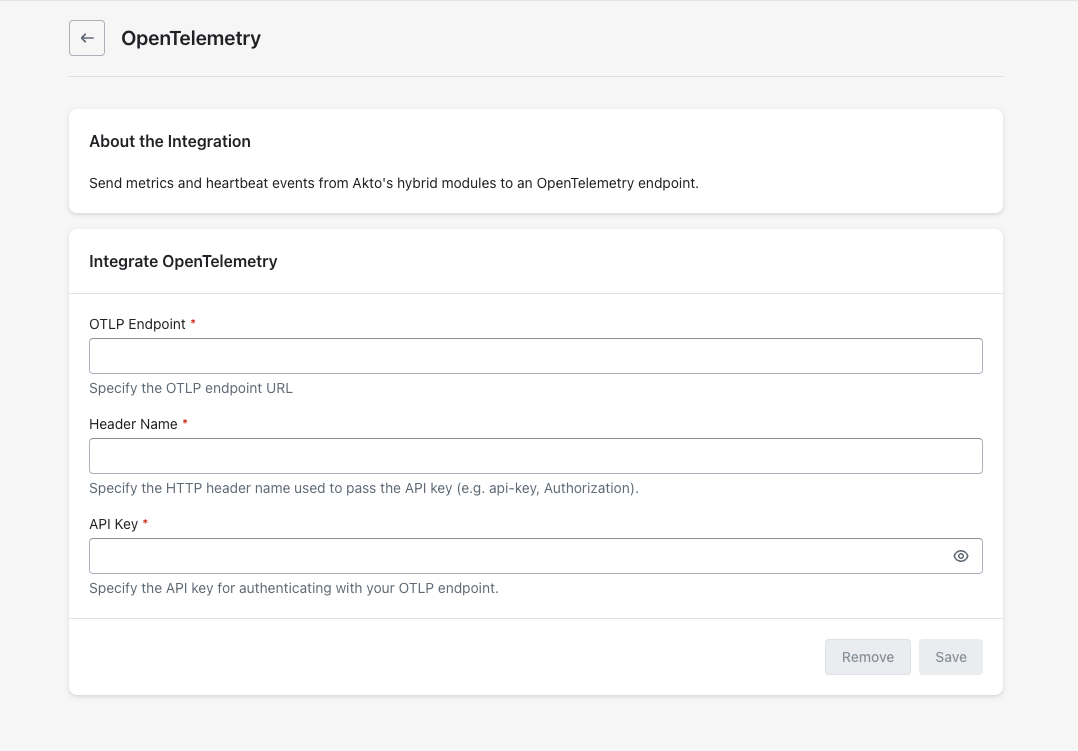
**Enter OpenTelemetry (OTLP) Endpoint Details**
1. Enter **OTLP endpoint**.
2. Enter authentication details.
1. Enter **Header name**.
2. Enter **API Key**.
If your OpenTelemetry endpoint requires a prefix before the API Key, please include the prefix when entering the API Key.
For example: Basic YOUR_API_KEY_HERE
{% endstep %}
{% step %}
**Save Configuration**
* Click **"Save"** to finalise.
{% endstep %}
{% endstepper %}
## Data Reference
Akto sends two types of telemetry to your OpenTelemetry endpoint: **metrics** (flushed every 120 seconds) and **heartbeat events** (sent every 30 seconds per module).
All signals are emitted with `service.name = akto-telemetry` on the OTLP resource.
### Heartbeat Event
Each Akto module emits an OTLP log record with `event.name` set to `AktoModuleHeartbeatReceived` every 30 seconds, sent to the `/v1/logs` endpoint. In your OTLP backend, filter log records where `event.name = AktoModuleHeartbeatReceived` to query them.
The log record carries the following attributes:
| Attribute | Description |
| ----------------------------------- | ------------------------------------------------- |
| `akto.account.id` | Akto account ID |
| `akto.account.name` | Akto account name |
| `akto.organization.id` | Akto organization ID |
| `akto.organization.name` | Akto organization name |
| `akto.module.id` | Unique ID of the module instance |
| `akto.module.type` | Module type (e.g. `MINI_RUNTIME`, `MINI_TESTING`) |
| `akto.module.name` | Human-readable module name |
| `akto.module.currentVersion` | Deployed version of the module |
| `akto.module.startedTs` | Unix timestamp when the module started |
| `akto.module.lastHeartbeatReceived` | Unix timestamp of the last heartbeat |
### Metrics
All metrics are prefixed `akto.metric.` and flushed every **120 seconds** to the `/v1/metrics` endpoint. Each metric includes the same module and account attributes listed in the heartbeat table above. Metrics are emitted as either a `LongCounter` or `DoubleGauge` OTLP instrument.
#### Runtime metrics
Emitted by the **Mini-Runtime** modules.
| Metric name | OTLP instrument | Description |
| ----------------------------------------- | --------------- | ---------------------------------------------------------- |
| `akto.metric.rt_kafka_record_count` | `LongCounter` | Number of records processed by the runtime module |
| `akto.metric.rt_kafka_record_size` | `LongCounter` | Total byte size of records processed by the runtime module |
| `akto.metric.rt_kafka_latency` | `DoubleGauge` | Average processing latency for runtime records |
| `akto.metric.rt_api_received_count` | `LongCounter` | Number of APIs received by the mini-runtime module |
| `akto.metric.kafka_records_lag_max` | `DoubleGauge` | Maximum consumer lag across Kafka partitions |
| `akto.metric.kafka_records_consumed_rate` | `DoubleGauge` | Current rate of Kafka record consumption |
| `akto.metric.kafka_fetch_avg_latency` | `DoubleGauge` | Average fetch latency from Kafka |
| `akto.metric.kafka_bytes_consumed_rate` | `DoubleGauge` | Current byte consumption rate from Kafka |
| `akto.metric.cyborg_new_api_count` | `LongCounter` | Newly discovered APIs detected in the flush window |
| `akto.metric.cyborg_total_api_count` | `LongCounter` | Total APIs tracked by Cyborg |
| `akto.metric.delta_catalog_new_count` | `LongCounter` | New items added to the delta catalog |
| `akto.metric.delta_catalog_total_count` | `LongCounter` | Total items in the delta catalog |
| `akto.metric.cyborg_api_payload_size` | `LongCounter` | Total size of API payloads processed by Cyborg |
#### Testing metrics
Emitted by the **Mini-Testing** module.
| Metric name | OTLP instrument | Description |
| ------------------------------------------------ | --------------- | ---------------------------------------------- |
| `akto.metric.testing_run_count` | `LongCounter` | Test runs executed in the flush window |
| `akto.metric.testing_run_latency` | `DoubleGauge` | Average time to complete a test run |
| `akto.metric.sample_data_fetch_latency` | `DoubleGauge` | Average latency for single sample-data fetches |
| `akto.metric.multiple_sample_data_fetch_latency` | `DoubleGauge` | Average latency for bulk sample-data fetches |
#### Cyborg metrics
Emitted by any module that calls Cyborg.
| Metric name | OTLP instrument | Description |
| --------------------------------- | --------------- | ----------------------------------- |
| `akto.metric.cyborg_call_count` | `LongCounter` | Calls made to Cyborg |
| `akto.metric.cyborg_call_latency` | `DoubleGauge` | Average Cyborg call latency |
| `akto.metric.cyborg_data_size` | `LongCounter` | Total data size sent to/from Cyborg |
#### Infrastructure metrics
Emitted by every module, reflecting the JVM process running that module.
| Metric name | OTLP instrument | Description |
| -------------------------------------- | --------------- | -------------------------------------- |
| `akto.metric.cpu_usage_percent` | `DoubleGauge` | Process CPU usage (%) |
| `akto.metric.heap_memory_used_mb` | `DoubleGauge` | JVM heap memory in use (MB) |
| `akto.metric.heap_memory_max_mb` | `DoubleGauge` | Maximum JVM heap memory available (MB) |
| `akto.metric.non_heap_memory_used_mb` | `DoubleGauge` | JVM non-heap memory in use (MB) |
| `akto.metric.thread_count` | `DoubleGauge` | Number of live JVM threads |
| `akto.metric.available_processors` | `DoubleGauge` | CPU cores available to the JVM |
| `akto.metric.total_physical_memory_mb` | `DoubleGauge` | Total physical host memory (MB) |
## Get Support for your Akto setup
There are multiple ways to request support from Akto. We are 24X7 available on the following:
1. In-app `intercom` support. Message us with your query on intercom in Akto dashboard and someone will reply.
2. Join our [discord channel](https://www.akto.io/community) for community support.
3. Contact `help@akto.io` for email support.
4. Contact us [here](https://www.akto.io/contact-us).